Álgebra Linear Computacional

Aula 15: Regressão Linear

Heitor S. Ramos
ramosh@dcc.ufmg.br

Créditos

Important

Os slides desse curso são fortemente baseados no curso do Fabrício Murai e do Erickson Nascimento

Objetivos de aprendizagem

  1. Entender os principais conceitos sobre regressão linear
  2. Entender como formular o problema de mínimos quadrados
  3. Aprender a derivar as equações matriciais relacionadas à regressão linear
  4. Derivar os coeficientes angulares e lineares da reta que melhor representa o conjunto de dados

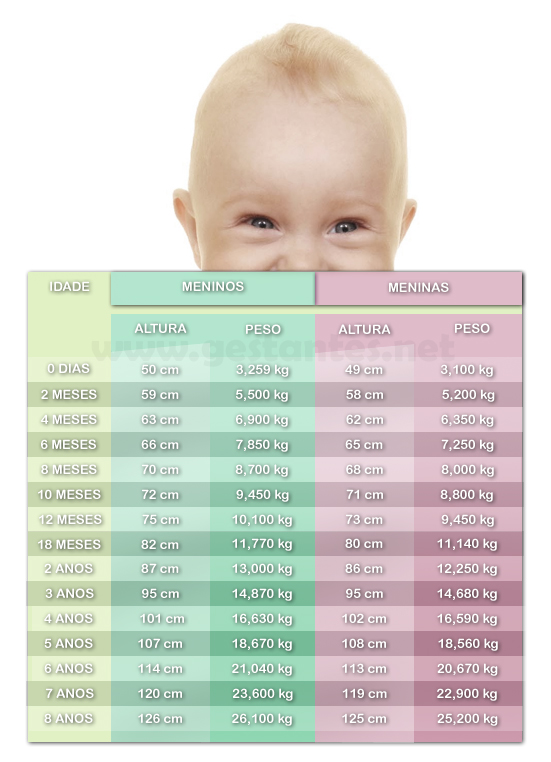
Altura dos Bebês

  • Existe uma relação entre o tamanho e a idade de uma criança?
  • Se sim, como essa relação se comporta?

Vamos analisar os dados

Idade Altura
18 76.1
19 77
20 78.1
24 79.9
25 81.1
27 81.8
28 82.8
29 83.5

Vamos analisar os dados

Idade Altura
18 76.1
19 77
20 78.1
24 79.9
25 81.1
27 81.8
28 82.8
29 83.5
Code
import numpy as np
import matplotlib.pyplot as plt
from sklearn.linear_model import LinearRegression
x = np.array([18,19,20,24,25,27,28,29]).reshape(-1, 1)
y = np.array([76.1, 77, 78.1, 79.9, 81.1, 81.8, 82.8, 83.5]).reshape(-1, 1)
model = LinearRegression()
model.fit(x, y)
plt.scatter(x, y)
plt.plot(x,model.predict(x), color="red")

Os dados reais não se alinham perfeitamente à reta

Idade Altura
18 76.1
19 77
20 78.1
24 79.9
25 81.1
27 81.8
28 82.8
29 83.5
Code
import numpy as np
import matplotlib.pyplot as plt
from sklearn.linear_model import LinearRegression
x = np.array([18,19,20,24,25,27,28,29]).reshape(-1, 1)
y = np.array([76.1, 77, 78.1, 79.9, 81.1, 81.8, 82.8, 83.5]).reshape(-1, 1)
model = LinearRegression()
model.fit(x, y)
plt.scatter(x, y)
plt.plot(x,model.predict(x), color="red")

Modelo de regressão

Code
import numpy as np
import matplotlib.pyplot as plt
from sklearn.linear_model import LinearRegression
x = np.array([18,19,20,24,25,27,28,29]).reshape(-1, 1)
y = np.array([76.1, 77, 78.1, 79.9, 81.1, 81.8, 82.8, 83.5]).reshape(-1, 1)
model = LinearRegression()
model.fit(x, y)
plt.scatter(x, y)
plt.plot(x,model.predict(x), color="red")

Reta \(r\colon y = \beta_1 x + \beta_0\)

Resíduos

Code
import numpy as np
import matplotlib.pyplot as plt
from sklearn.linear_model import LinearRegression
x = np.array([18,19,20,24,25,27,28,29]).reshape(-1, 1)
y = np.array([76.1, 77, 78.1, 79.9, 81.1, 81.8, 82.8, 83.5]).reshape(-1, 1)
model = LinearRegression()
model.fit(x, y)
plt.scatter(x, y)
predicted=model.predict(x)
plt.plot(x,predicted, color="red")
plt.ylim=range(76,83)
plt.annotate("$y_2$", (x[2],y[2]), xytext=(x[2],y[2]+.5))
plt.annotate("$\hat{y}_2$", (x[2],predicted[2]), xytext=(x[2],predicted[2]-.5) )
plt.annotate("$e_2$", (x[2],predicted[2]+.2), xytext=(x[2]-.8,predicted[2]+.2), arrowprops=dict(arrowstyle='->', color='blue', linewidth=2))
for i in range(8):
    plt.vlines(x[i], y[i], predicted[i])

plt.show()

Reta \(r\colon y = \beta_1 x + \beta_0\)

Resíduos:

\(e_1 = y_1 - \hat{y}_1\) \(e_2 = y_2 - \hat{y}_2\)

\[\vdots\]

\(e_n = y_n - \hat{y}_n\)

\(e_n = y_n - (\beta_1 x_n - \beta_0)\)

Qual reta eu devo escolher?

Code
import numpy as np
import itertools   
import matplotlib.pyplot as plt
from sklearn.linear_model import LinearRegression
x = np.array([5,7,8,13,3,17,2,10,4,11,12,9,6]).reshape((-1,1))
y = np.array([99,86,87,88,111,86,103,92,94,78,77,85,86]).reshape((-1,1))
model = LinearRegression()
model.fit(x, y)
plt.scatter(x, y)
predicted=model.predict(x)
plt.plot(x,predicted, color="red")
plt.plot(x,np.repeat(94, 13), color="green")

for i in range(13):
    plt.vlines(x[i], y[i], predicted[i], color="red")

for i in range(13):
    plt.vlines(x[i], y[i], 94, color="green")

plt.show()

Note

Nosso objetivo é escolher a reta que minimiza os resíduos

Critério de escolha da reta

  • Buscar a reta que minimiza a soma de todos os resíduos
  • Vamos calcular \(\beta_0\) e \(\beta_1\) que minimize a soma dos quadrados dos resíduos

\[E = \sum_{i=1}^n (y_i -\beta_1x_0 - \beta_0)^2\]

Code
import numpy as np
import itertools   
import matplotlib.pyplot as plt
from sklearn.linear_model import LinearRegression
x = np.array([5,7,8,13,3,17,2,10,4,11,12,9,6]).reshape((-1,1))
y = np.array([99,86,87,88,111,86,103,92,94,78,77,85,86]).reshape((-1,1))
model = LinearRegression()
model.fit(x, y)
plt.scatter(x, y)
predicted=model.predict(x)
plt.plot(x,predicted, color="red")

for i in range(13):
    plt.vlines(x[i], y[i], predicted[i], color="red")

plt.show()

Formulação em formato matricial

\((x_1, y_1)\) \(y_1 - x_1\beta_1 - \beta_0 = e_1\)
\((x_2, y_2)\) \(y_2 - x_2\beta_1 - \beta_0 = e_2\)
\(\vdots\) \(\vdots\)
\((x_n, y_n)\) \(y_n - x_n\beta_1 - \beta_0 = e_n\)

perceba que

\[x_1\beta_1 + \beta_0 = \begin{bmatrix}x_1 & 1\end{bmatrix}\begin{bmatrix}\beta_1\\\beta_0\end{bmatrix}\]

se tivermos \(n\) pontos, teremos \(n\) vetores

\[\begin{bmatrix}x_1 & 1\end{bmatrix}^\top\] \[\begin{bmatrix}x_2 & 1\end{bmatrix}^\top\] \[ \vdots\] \[\begin{bmatrix}x_n & 1\end{bmatrix}^\top\]

e teremos \(n\) valores de y. Assim podemos formatá-lo como um vetor

\[ b= \begin{bmatrix}y_1&\ldots&y_n\end{bmatrix}^\top\]

ao escrevermos todos os valores de \(x\) em uma matriz e os parâmetros \(\beta_0\), \(\beta_1\) em um vetor \(x = \begin{bmatrix}\beta_0 & \beta_1\end{bmatrix}^\top\) temos

\[ Ax = b + e\]

\[ \begin{bmatrix} 1 & x_1\\ 1 & x_2 \\ \vdots & \vdots \\ 1 & x_n \end{bmatrix} \begin{bmatrix} \beta_0\\ \beta_1 \end{bmatrix} = \begin{bmatrix} y_1\\ y_2\\ \vdots\\ y_n \end{bmatrix} + \begin{bmatrix} e_1\\ e_2\\ \vdots\\ e_n \end{bmatrix} \]

Como encontrar a melhor reta?

  • queremos encontrar o vetor \(x\) que minimize o erro (resíduos) entre \(Ax\) e \(b\), ou seja, \(e = \Vert Ax -b \Vert\)

  • queremos \[ x^* = \text{arg}\min_x \Vert Ax -b \Vert^2\]

Equações normais

\[A \underbrace{x}_{\text{coeficientes}} = b + \underbrace{e}_{\text{resíduos}}\]

Ou seja, o erro é dado por \[e = Ax+b\]

Consideremos \(\hat{x}\) como a melhor solução possível, ou seja \[e = A\hat{x} - b\] é o menor erro possível

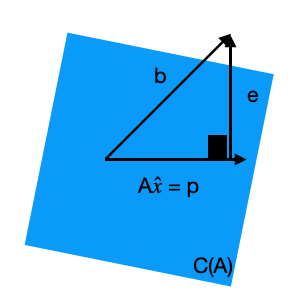
Perceba que \(A\hat{x}=p\), onde \(p\) é um vetor formado pela combinação linear das colunas de \(A\), ou seja, \(p\in C(A)\) Interpretação geométrica

\(Ax=p\) será perpendicular ao vetor \(e\). Sendo assim, \(p^\top e = 0\). Como \(e = A\hat{x}-b\) temos

\[\begin{align} (A\hat{x})^\top (A\hat{x}-b) &= 0 \\ x^\top \underbrace{A^\top (A\hat{x} - b)}_{0} &= 0 \end{align}\]

Equação normal

\[ A^\top A \hat{x} - A^\top = 0\] ou

\[ A^\top A \hat{x} = A^\top b\]

Solução da equação normal

\[ A^\top A \hat{x} = A^\top b\]

Sejam

\[A = \begin{bmatrix}1 & x_1\\ \vdots & \vdots\\ 1 & x_n\end{bmatrix} \]

e \[ b = \begin{bmatrix}y_1 \\ \vdots\\ y_n\end{bmatrix}\]

Vamos analisar a matriz \(A^\top A\)

\[\begin{align} A^\top A &= \begin{bmatrix} 1 & 1 & \ldots & 1\\ x_1& x_2& \ldots & x_n \end{bmatrix} \begin{bmatrix} 1 & x_1\\ 1 & x_2 \\ \vdots & \vdots \\ 1 & x_n \end{bmatrix}\\ &= \begin{bmatrix} \sum_{i=1}^n 1 & \sum_{i=1}^n x_i \\ \sum_{i=1}^n x_i & \sum_{i=1}^n x_i^2 \end{bmatrix}\\ &=\begin{bmatrix} n & \sum_{i=1}^n x_i \\ \sum_{i=1}^n x_i & \sum_{i=1}^n x_i^2 \end{bmatrix} \end{align}\]

Agora vamos analisar a matriz \(A^\top b\) \[\begin{align} A^\top b &= \begin{bmatrix} 1 & 1 & \ldots & 1\\ x_1& x_2& \ldots & x_n \end{bmatrix} \begin{bmatrix} y_1 \\ \vdots\\ y_n \end{bmatrix}\\ &= \begin{bmatrix} \sum_{i=1}^n y_i \\ \sum_{i=1}^n x_iy_i \end{bmatrix} \end{align}\]

Como solucionar \(A^\top A \hat{x} = A^\top b\) para \(\hat{x}\)?

Método 1:

\[\begin{align} A^\top A\hat{x} &= A^\top b \\ (A^\top A)^{-1}A^\top A\hat{x} &= (A^\top A)^{-1}A^\top b\\ \hat{x} &= (A^\top A)^{-1}A^\top b \end{align}\]

A inversa de uma matrix \(2\times 2\) pode ser denotada pelo produto do recíproco do determinante da matrix pela adjunta da matrix, ou seja

\[ \begin{bmatrix} a & b\\ c & d \end{bmatrix}^{-1} = \frac{1}{ad - bc} \begin{bmatrix} d & -b\\ -c & a \end{bmatrix} \]

Sendo assim, \[ (A^\top A)^{-1} = \frac{1}{n\sum x_i^2 - \left(\sum x_i\right)^2} \begin{bmatrix} \sum x_i^2 & -\sum x_i \\ - \sum x_i & n \end{bmatrix} \]

Como \(\hat{x} = (A^\top A)^{-1} A^\top b\), temos

\[\begin{align} \hat{x} &= \frac{1}{n\sum x_i^2 - \left(\sum x_i\right)^2} \begin{bmatrix} \sum x_i^2 & -\sum x_i \\ - \sum x_i & n \end{bmatrix} \begin{bmatrix} \sum y_i \\ \sum x_iy_i \end{bmatrix} \\ &= \frac{1}{n\sum x_i^2 - \left(\sum x_i\right)^2} \begin{bmatrix} \sum x_i^2 \sum y_i - \sum x_i \sum x_i y_i\\ n\sum x_i y_i - \sum x_i \sum y_i \end{bmatrix} \end{align}\]

\[ \beta_1 = \frac{n \sum x_iy_i - \sum x_i \sum y_i}{n\sum x_i^2 - (\sum x_i)^2}\]

\[ \beta_0 = \frac{\sum y_i - \beta_1 \sum x_i}{n}\]

Método 2: \[ A^\top A \hat{x} = A^\top b\]

\[ \begin{bmatrix} n & \sum x_i \\ \sum x_i & \sum x_i^2 \end{bmatrix} \begin{bmatrix} \beta_0\\ \beta_1 \end{bmatrix}= \begin{bmatrix} \sum y_i \\ \sum x_iy_i \end{bmatrix} \]

Fazendo eliminação de Gauss temos

\[ \begin{bmatrix} n & \sum x_i \\ 0 & -\frac{1}{n}(\sum x_i)^2 + \sum x_i^2 \end{bmatrix} \begin{bmatrix} \beta_0\\ \beta_1 \end{bmatrix} = \begin{bmatrix} \sum y_i \\ -\frac{1}{n}\sum x_i \sum y_i + \sum x_iy_i \end{bmatrix} \]

\[ \beta_1 = \frac{n \sum x_iy_i - \sum x_i \sum y_i}{n\sum x_i^2 - (\sum x_i)^2}\]

\[ \beta_0 = \frac{\sum y_i - \beta_1 \sum x_i}{n}\]

As equações acima podem ser reorganizadas da seguinte forma \[\beta_1 = \frac{\sum_{i=1}^{n} ( x_i - \bar{x})(y_i - \bar{y}) }{\sum_{i=1}^{n} ( x_i - \bar{x})^2} \]

\[\beta_0 = \bar{y} - \beta_1 \bar{x} \] ## Avaliando a qualidade do ajuste{.scrollable}

Code
import numpy as np
import matplotlib.pyplot as plt
from sklearn.linear_model import LinearRegression
from sklearn.preprocessing import StandardScaler

x = np.array([5,7,8,13,3,17,2,10,4,11,12,9,6])
y = np.array([99,86,87,88,111,86,103,92,94,78,77,85,86])

num = x.shape[0]*np.sum(x*y) - np.sum(x)*np.sum(y)
den = x.shape[0]*np.sum(x**2) - np.sum(x)**2
b1 = num/den
b0 = (np.sum(y) - b1*np.sum(x))/x.shape[0]


y_hat = b0 + x*b1

plt.scatter(x, y)
plt.plot(x,y_hat, color="red")

for i in range(13):
    plt.vlines(x[i], y[i], predicted[i], color="red")

plt.show()

xy = np.stack((x,y),axis=1)
x_std = StandardScaler().fit_transform(xy)

print('correlacao:', np.corrcoef(x,y))

print('correlacao (manual):', (x_std.T @ x_std)/x_std.shape[0])

correlacao: [[ 1.        -0.6973462]
 [-0.6973462  1.       ]]
correlacao (manual): [[ 1.        -0.6973462]
 [-0.6973462  1.       ]]

A qualidade do ajuste

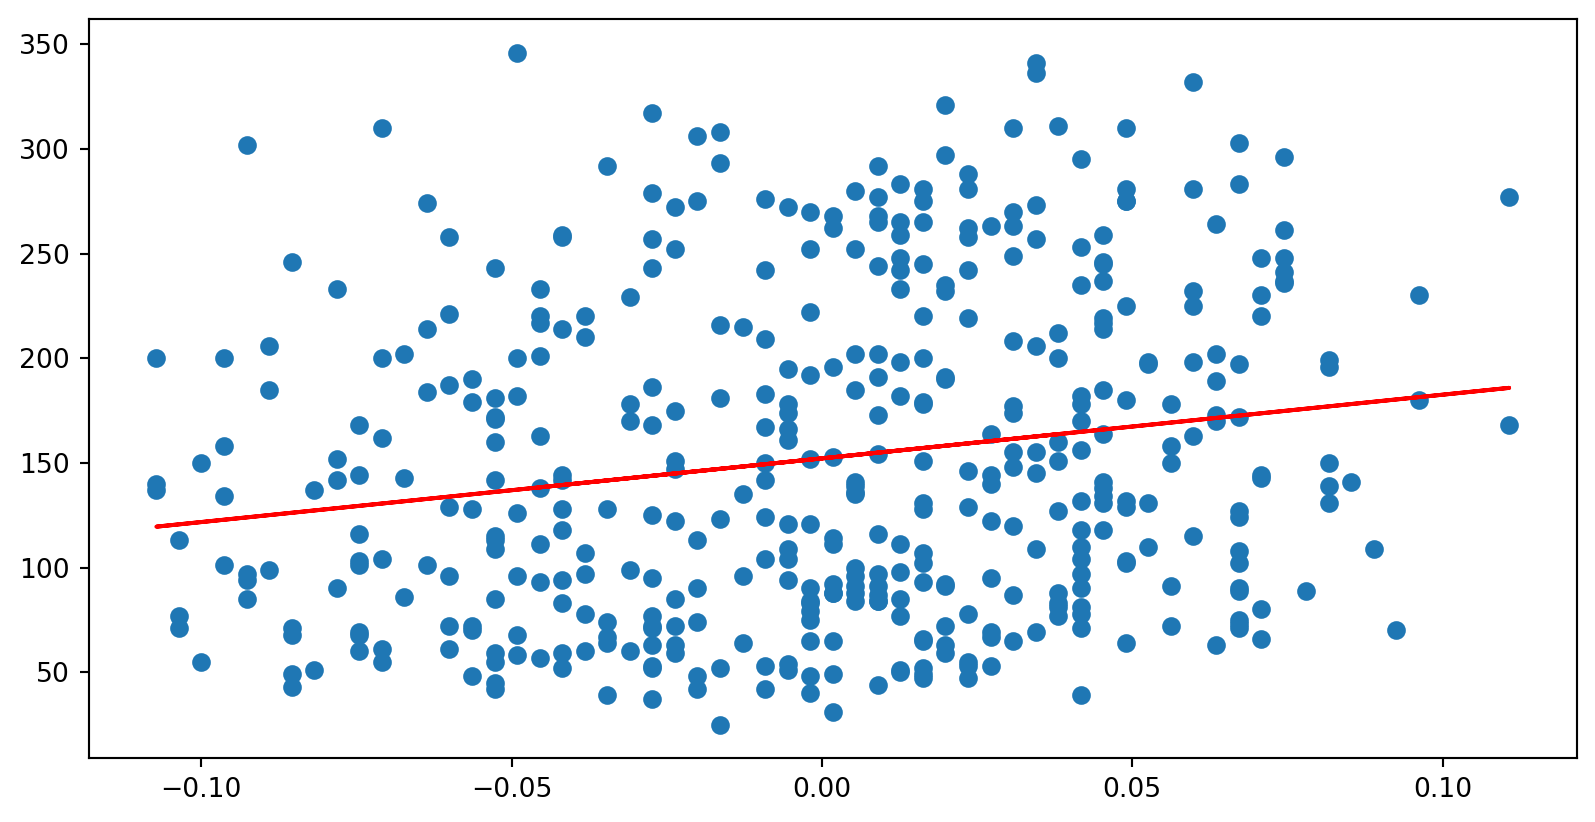
  • A qualidade do ajuste é geralmente indicado pelo quadrado do coeficiente de determinação (\(R^2\))
  • Ele indica o percentual de variabilidade da variável de resposta explicado pelo modelo
  • O restante é explicado por variáveis que não estão presentes no modelo ou por variabilidade inerente dos dados
  • Do modelo anterior, temos \(R^2 = -0.6973462 * -0.6973462 = 0.4862917\)

Exemplo

Code
import numpy as np
import matplotlib.pyplot as plt
from sklearn import datasets
from sklearn.linear_model import LinearRegression
from sklearn.preprocessing import StandardScaler
from sklearn.linear_model import LinearRegression

dataset = datasets.load_diabetes(as_frame=True)
trigliceridios = np.array(dataset['data']['s5']).reshape((-1,1))
diabetes = np.array(dataset['target']).reshape((-1,1))
idade = np.array(dataset['data']['age']).reshape((-1,1))
model = LinearRegression()
model.fit(trigliceridios,diabetes)
model2 = LinearRegression()
model2.fit(idade,diabetes)
r_squared = model.score(trigliceridios, diabetes)
r_squared2 = model2.score(idade, diabetes)
plt.scatter(trigliceridios,diabetes)
plt.plot(trigliceridios,model.predict(trigliceridios),color="red")
plt.show()
print('trigliceridios',r_squared)
print('idade', r_squared2)
plt.scatter(idade,diabetes)
plt.plot(idade,model2.predict(idade),color="red")

trigliceridios 0.3202231084297208
idade 0.03530218264671636